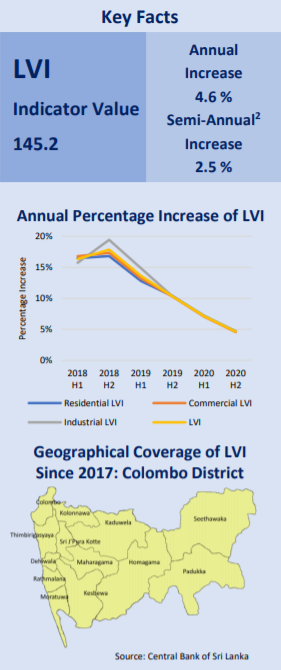
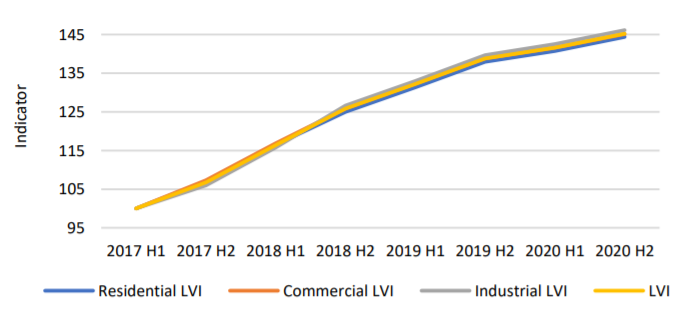
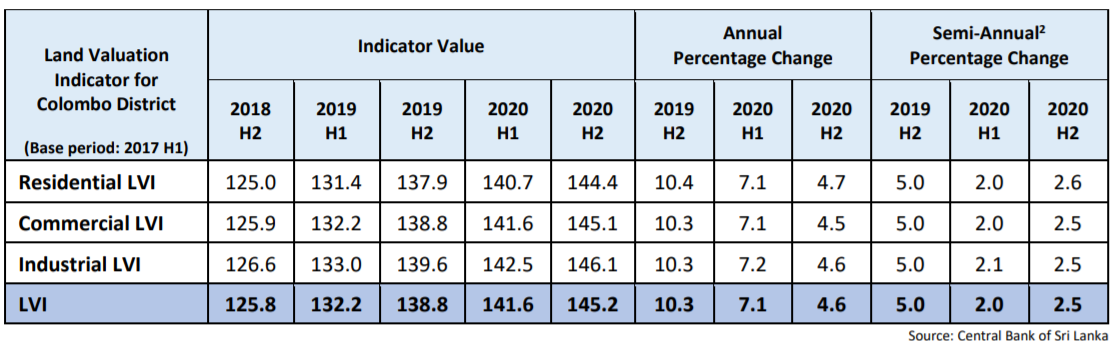
Land Valuation Indicator (LVI) for Colombo District increased by 4.6 percent on a year-on-year basis to 145.2 during the second half of 2020. However, the percentage level of increase of LVI was in line with the declining trend observed over the recent periods. In addition, the LVI recorded an increase of 2.5 percent for the second half of 2020 compared to the first half of 2020.
All sub-indicators of LVI, namely Residential LVI, Commercial LVI, and Industrial LVI contributed to the overall increase. Residential LVI recorded the highest annual increase of 4.7 percent, followed by Industrial LVI and Commercial LVI.
Technical Note:
Coverage and Frequency
The Land Price Index (LPI) compiled from 1998 to 2008 on an annual basis and from 2009 to 2017 on a semiannual basis, covering 5 DS divisions in the Colombo District. Subsequently, from 2017 onwards, its geographical coverage was enhanced to represent all 13 DS divisions in the Colombo District and hence it was rebased considering 1st half of 2017 as the base period. From 2020 onwards LPI was renamed as Land Valuation Indicator (LVI) and continued to be released on a semi-annual basis.
Data Source
Per perch, bare land prices are obtained from the Government Valuation Department on a semi-annual basis.
Methodology
Considering the diverse nature of land use, and the necessity of maintaining homogeneity, three sub-indicators for residential, commercial, and industrial lands are computed separately for each DS division using the average per perch bare land price in the area. The LVI is the simple average of these three sub-indicators.
Movements of LVI (2017 H1 = 100)
Land Valuation Indicator and Growth Rates
Reference: Central bank of Sri Lanka